Three data sets. One decision-ready picture.
Curriculum, MIS, and SEND data combine into a single view of need.
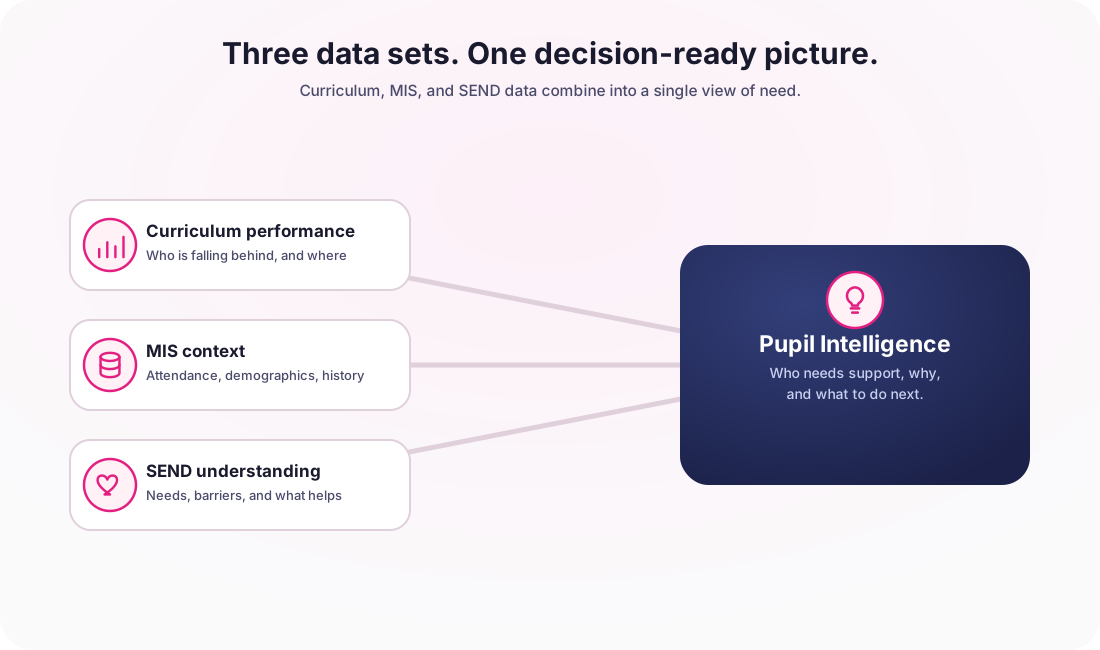
Curriculum performance and learner support data have lived in different systems for two decades. The Curriculum Intelligence dashboard connects them, so the moment a cohort underperforms, you can already see which learners need support, why, and what to do.
Curriculum, MIS, and SEND data combine into a single view of need.
Curriculum Intelligence isn't just a dashboard bolted onto your data: it's how the curriculum gets run in the first place.
Without the SEN filter, a cohort just looks behind. Switch it on to see how much of that gap is being driven by learners with identified SEN needs. Same signal, very different actions.
of the Y2 Maths cohort are behind expected progress. On its own, that just looks like underperformance. The cause isn't yet clear.
It looks like a curriculum delivery issue. The action is unclear and risks targeting the wrong root cause.
of the underperforming Y2 Maths cohort have identified SEN needs. This isn’t a teaching gap. It’s a provision gap.
Review provision and targeted support. Allocate intervention time to the learners whose support plans need updating.
of the Y8 English cohort are behind expected progress. Same signal as the previous scenario: flat, without context.
It looks identical to a SEN-driven dip. The school risks chasing the wrong intervention.
of the underperforming Y8 English cohort have identified SEN needs. The pattern doesn’t fit SEN. It’s a curriculum delivery question.
Review curriculum delivery. The intervention belongs in lesson design and pedagogy, not in SEN support.
Rolling out across UK and international schools through 2026. The full Curriculum Intelligence dashboard, with SEND filter, learning-outcome drill-down, and learner-level views, is live now. Book a demo to see it in action.
Schools have great curriculum tools. Great MIS. Great SEND platforms. None of them speak to each other. Cohort underperformance is visible. The reason it’s happening is invisible.
Shows you which cohorts are below threshold. Stops there. No way to filter by learner need. No way to drill to individual learner profile.
Records attendance, grades, and statutory data. Wasn’t designed to answer questions about provision impact or developmental progress.
Holds the support plan for 60 identified learners. Disconnected from the curriculum data that says they’re falling behind in Year 2 Maths.
When the Year 2 Maths cohort drops 10 points below the school average, every headteacher asks the same question: is this a teaching problem, or are we under-supporting learners with identified needs?
Apply the SEN filter in PAGS. If 68% of the underperformers have identified needs and current provision for Fractions is insufficient, you have your answer. Change the provision. Track the impact. The gap closes.
See it from the headteacher perspective →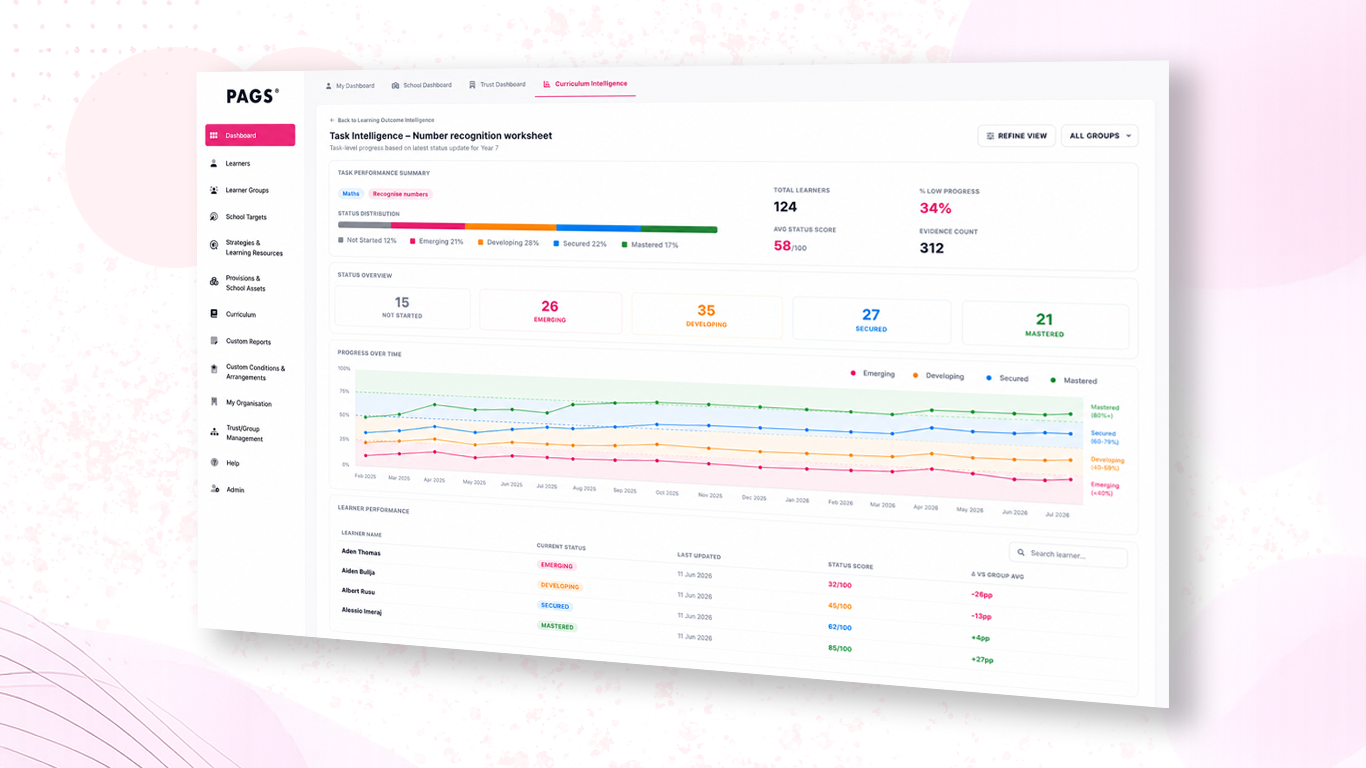
Each layer drills into the next without leaving PAGS. From governance overview to a learner profile in three clicks.
Curriculum Intelligence presents itself differently for the SENCO, the teacher, and the headteacher, because they’re asking different questions of the same data.
Layer 4: learner-level view filtered by identified needs. See exactly which learners are below threshold in each subject, and one-click drill into their profile to apply targets or provision.
Layer 3: class-level cohort view. See which learning outcomes your class is below on, what each learner needs, and surface the most relevant target for today’s topic.
Layer 1 + 2: whole-school view down to subject and outcome level. Spot underperforming cohorts and apply the SEN filter before the data becomes an end-of-year problem.
PAGS has given us complete visibility across all of our schools for the first time. We can see best practice in one school and apply it in another, because every school is working from the same curriculum and SEND view.
Linda Stevens · SENCO Lead, ALET Education Trust
6 schools across Berkshire, outer London and Oxfordshire
Before you book: PAGS shows you which pupils are falling behind, why, and what to do next.
UCL validated · 4 countries · From £1,450/year · GDPR compliant